Facebook is a wonderful thing – over the Christmas break I had only two things in my feed, Star Wars and fishing, of course the only thing that has changed since then is now I get more fishing. One topic that has come up, especially among the younger locals is the issue of bag limits, especially around sportfish species.
This ties into what I think might well be the Suntag theme this year – ‘What sort of fishery and fishing experience do you want?’ Here is a radical idea – bag limits are a safety net, a way to ensure that individual anglers cannot over-harvest without facing consequences. Bag limits are not a target, nor are they a measure of sustainability.
One of the ideas that I seem to encounter among younger fishers is that fisheries as the umpire need to get involved in the setting of arbitrary limits on catch and release species. That is, they want the limits to be set on the dominant harvest fishing style in an area including commercial fishing. In this case though, advocacy within the recreational sector may be a better approach. What is wrong with fishers adopting a lower bag limit voluntarily in order to improve a fishery?
In order to address this topic, I will look at a number of species through Suntag Data as well as the Statewide Recreational Fishing Survey 2013-14 and Commercial Data from the QFISH database. No doubt there will be disagreement on the numbers, but these are the best we have and a lot better than nothing.
Commercial Fishers always take the lion’s share of the fish, right? Not much concrete data exists on this observation but the Fisheries Recreational Review has a pretty good go at it.
While these are estimates, they are based on catch data and weight estimates from reasonable data collection sources. In lieu of better data, this is the best we have.
The available data shows that for key species, 43% of the catch was recreational, 57% commercial in 2013/14. This implies that even with bag limits in place, the recreational catch is still significant, even in the same ballpark as the commercial catch on these species.
The equation for a traditional harvest focus is more fishing effort results in less fish. We have more than 100 years of data both commercial and recreational globally to support this. However, this is an issue usually put upon the commercial sector.
These sorts of numbers show that there is certainly room for discussion in the recreational sector on what sort of standards we want to set for ourselves. As much as we put demands on the commercial sector, we as recreational fishers have some heavy lifting to do. I wonder how quickly the conversation will move from ‘not enough’ fish to ‘plenty if you know how to catch them’ when the focus changes.
One of the discussions I tracked was on mangrove jack where the young guys in the South East argued that a bag limit of two should be in place. A counter-argument claimed that up north they catch more mangrove jack. That was extended to suggest they are ‘like bream’ in some places.
Being a literalist, I decided to test this theory. While our data isn’t 100% complete up north, I can say that on balance of the data we had 2561 trips in the top ten sites up north. While there is evidence that some areas with less data have exceptional catch rates, when compared to bream, no site compares to any of the decent bream sites.
On a top ten mangrove jack in the north against the top ten bream in the south, on every measure there isn’t really a comparison. In the same 15-year period there are nearly 30,000 bream recorded in the top ten bream sites with 9.3% of trips recording five plus legal sized bream. Only Deepwater Creek is comparable, with 9.4% of trips with five plus legal size mangrove jack but that is only from 85 trips in total.
Over a 15-year period, only 1.5% of trips managed to make the five-bag limit within Suntag. While there have been seven trips in the Pumicestone Passage that have managed to make the bag limit, none have been recorded on the Sunshine Coast, Moreton Bay or Gold Coast. Doubtless there will be fishers who have managed this all the same.
Here are some things to also consider (from the Recreational Fishing Survey):
• Mangrove jack are mostly caught when not actively targeted (0-25% caught as target).
• Only 8% of mangrove jack released are targeted for catch and release (as opposed to 77% that are too small).
• 75% of mangrove jack are caught in estuaries, 21% inshore and 4% offshore.
• Mangrove jack catch is larger in the north than in the south.
• A bag limit of two per person as advocated would impact the catch in the north in terms of take home catch.
• Mangrove jack are a key species in the mix for places from Mackay North into the Gulf.
Looking at the Suntag data, getting a bag of mangrove jack in SEQ is not an everyday thing.
Why use the 4+ Trip measure? This is a reflection of the fishing experience as Suntag fishers mostly focus on specific species and specialize in catching them largely with lures. For Suntag fishers getting numbers matters even if they are released. Note – the four fish must be of legal Fisheries definitions, not just four fish.
This is where recreational fishers, coming to their own arrangements is a good step. Sportfishers in SEQ want to come to a voluntary process to a reduced bag limit and be strong, positive advocates on Facebook, this can only help keep stocks in the water.
If the majority of fishers then agree with the voluntary bag limit, or there is simply too much pressure on stocks,
which will result in the change of actual bag limits may make sense. Simply enforcing it based on fishing experience in one end of the state though isn’t going to be a popular idea and will be difficult to achieve.
One place where a voluntary bag limit is being seriously considered is in the Rockhampton Net Free Zone. This will be a community decision, but discussion has focused on a voluntary target around two barramundi. In this way, Rockhampton will quite likely be a test case for what sort of effect a voluntary bag limit will have, and no doubt many will be watching closely.
So what do catches in Rockhampton look like? In the last 15-years in the Net Free Zone area trips where fishers have managed to catch the equivalent of the bag limit have been few. How does Rockhampton compare with the statewide results? In order to compare like for like, the rate of trips where more than four legal barramundi were recorded. Rockhampton underperformed the state until 2012, so the once in 30-year turnaround has had a significant effect.
Rockhampton dipped below the state average for making bag limit in 2015, so it will be very interesting to see what effect the NFZ has. If Rockhampton does truly become the barramundi capital it aims to be, it will be a testimony to the restraint of the community in taking advantage of the new opportunities.
When looking for a way to see how useful the ‘trips where bag limit was near reached’ measure, a good many species were examined. Snapper proved to be one of the most interesting.
The statewide fisheries review makes some pretty interesting observations about snapper:
• In the survey period the recreational and commercial catch were roughly equal 82 tonne.
• Only 1% of snapper released are from catch and release fishing (98% due to undersize capture).
• Snapper are targeted only 26-50% of the time they are caught.
• 27% of snapper are harvested.
Snapper are still one of the species that are considered to be in trouble concerning numbers. Our snapper data has been pretty consistent over the past 15-years with around 185 trips a year and only one year with less than 100 trips (2001– 96 recorded trips).
Trips from 2011 onwards show an increase in the number of trips where the snapper bag limit is reached. In fact, the 8% rate of recent years is better than experienced in barramundi, though our barramundi data is stronger. This suggests that the harvest controls implemented on the recreational sector have had a positive effect even without controls being put on the commercial sector. As always, more data will flesh that out but on balance I am inclined to give Fisheries a tick of approval. Recreational fishers may feel aggrieved but in the end what is the objective? Is it not, more fish and a fishery in better shape? If anything, the recreational sector should be proud that they can make an impact.
Surely if snapper numbers improve through recreational restraint then that is a good reason for recreational fishers to voluntarily reduce their take.
Yes, in a perfect world both sectors would contribute and make a virtue of it. Both sectors still have some work to do on this front in terms of embracing that idea.
What happens when you stop taking fish? What happens when you have a species that is truly catch and release? As it happens, most of the ‘catch and release’ species are freshwater species (according to the statewide survey), including Australian bass, sooty grunter, Murray and Mary River cod, though you could add jungle perch and saratoga in there as well. With the exception of sooty grunter, all have strict bag limits that largely enforce catch and release. Mary River cod are only allowed to be targeted in impoundments, not in wild streams.
The species we have the best data on overall is Australian bass, making it the logical candidate to examine closer.
The statewide fisheries review makes some pretty interesting observations about Australian bass:
• 72% of bass released are from catch and release fishing.
• Only 8% of bass are harvested.
• 79% are caught in impoundments.
• Bass are targeted in 76-100% of the time they are caught and are in the same class as beach worms, yabbies, pipis, prawns, mud crabs and red claw. They are the only fish species in this band.
To understand the impact of an enforced catch and release fishery, which by the two bass bag limit is enforced to the same degree as Murray cod. This is despite the fact that 57% of trips result in meeting the bag limit and 4% of trips (312 trips out of 7331 trips) result in 20+ fish caught.
By contrast, only 45 out of 713 trips have resulted in Suntag Murray cod fishers reaching their bag limit over the same period. However, for a comparison that really shows clearly the difference between a harvest and bag limit controlled species, golden perch is the go-to species. Both have been stocked, with golden perch in larger numbers based on the stocking comparisons available on the fisheries website. The major difference is golden perch is harvested, and bass isn’t. Australian bass is the number seven species by fishing effort, golden perch number nine. Only 33% of golden perch are released for catch and release fishing. Looking at the Suntag data, the difference in rates where 5+ fish were caught in a fishing session is pretty clear.
Australian bass is a clear indicator that where harvest controls are in place, be it social or legal and there are good opportunities for stocks to replenish, in this case via stocking, then fish stocks improve a lot.
There is strong and quantifiable evidence that increasing harvest pressure has a negative effect on stocks. Equally, there is strong and quantifiable evidence that constraining the catch has a positive effect. That has been the established fisheries practice for decades. The rate at which that effect kicks in is directly proportional to the level of replenishment of the stock, be it naturally or via stocking balanced against the level of constraint.
It is interesting that the Statewide Survey reports highest rates of catch and release among freshwater species with tight bag limits. I draw you back to the original question – ‘what sort of fishery and fishing experience do you want?’
It will be interesting to see what happens in Rockhampton as there is some pretty heavy monitoring going on. They want a great fishery, and fingers crossed that they get it.
This topic leads into a couple of other questions like ‘what constitutes a feed?’ As well as ‘where are all the catch and release fishers in the salt?’
In order to look at those questions, I will need several bottles of wine for inspiration.
Is there a question or issue that you would like us to look at? Send questions to --e-mail address hidden-- and we will do our best to provide an answer. Hate mail is also welcome.
Facts
| Species | Number | Weight (kg) | Rec harvest (kg) | Comm Harvest (kg) | Rec% Catch |
|---|---|---|---|---|---|
| Barramundi | 42,000 | 4.21 | 131,000 | 762,000 | 15 |
| Dusky flathead | 117,000 | 0.86 | 101,000 | 43,000 | 70 |
| Sand whiting | 482,000 | 0.20 | 96,000 | 204,000 | 32 |
| Snapper | 56,000 | 1.47 | 82,000 | 83,000 | 50 |
| Spanish mackerel | 34,000 | 7.22 | 243,000 | 588,000 | 29 |
| Spotted mackerel | 26,000 | 2.60 | 65,000 | 97,000 | 40 |
| Tailor | 111,000 | 0.68 | 75,000 | 57,000 | 57 |
| Yellowfin bream | 323,000 | 0.39 | 125,000 | 112,000 | 53 |
Facts
Data sources used in this article
| Commercial catch for QFISH | http://qfish.daf.qld.gov.au 2000 to 2015 |
|---|---|
| Tag and catch records | http://qld.info-fish.net 2000 to 2015 |
Statewide Recreational Fishing Survey 2013–14 by James Webley, Kirrily McInnes, Daniella Teixeira, Ashley Lawson and Ross Quinn from the Department of Agriculture and Fisheries.

Overall mangrove jack caught per trip 2000-2015 Statewide (Suntag data).
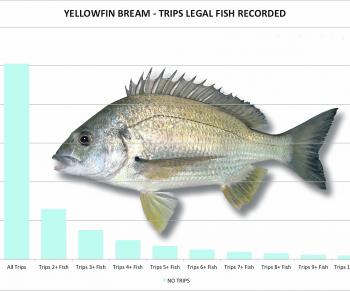
Overall yellowfin bream caught per trip 2000-2015 Statewide (Suntag data).

Trips where >=4 mangrove jack caught per trip 2000-2015 by Year Statewide (Suntag data).
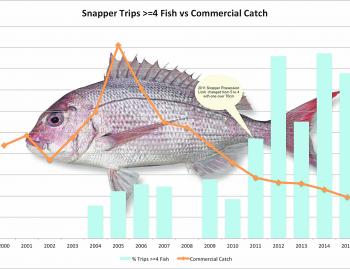
Trips where >=4 legal snapper caught per trip 2000-2015 by Year Statewide (Suntag data).