Depending on who you talk to, when the Moreton Bay Marine Park was established in March 2009 it had anything from little to a catastrophic effect on recreational fishing. For individual fishers their views were very much formed by the impact on them personally. But what was the overall impact? That is a tough question to answer as there are very little independent data that can be used to assess the affect.
One of the very few datasets that can provide an objective assessment is the Suntag tagging data of the Australian National Sportfishing Association Qld. Suntag is managed by Infofish Australia. Tagging by ANSAQ members has been ongoing in southeast Queensland since the mid 1980s with tagging before and after the Marine Park was established. Taggers have been recording tag locations using Suntag grid maps all that time which identifies where fish were tagged to around 1.5 square kilometres. By superimposing those tag grids on the marine park zones it is possible to provide an independent assessment of the affect of green zones on tagging and taggers.
It is worth noting that in 2007 aggregated tagging data, from taggers prepared to allow their data to be included, was provided to the then Environmental Protection Agency that was responsible for preparation of the zoning plan.
So what was the affect on tagging and taggers? There were a total of 883 grids where fish were tagged from Jan 1985-Feb 2014 within the marine park. Of these 793 (89.8%) were not affected by green zones. A total of 22 (2.5%) were totally included within the no fishing green zones and tagging ceased in those grids. There were a further 68 (7.7%) where part of the area within the grid was included in a green zone. Tagging has continued in a number of those grids in the area outside the green zone.
A more accurate assessment of the impact needs to be based on the level of tagging activity in those grids, not just the affect of the zoning. From Jan 1985-Mar 2009 (when the zoning came into effect) there were 68,545 fish tagged with 80.6% of those fish tagged in grids open to fishing, 5.6% in grids completely in green zones and 13.8% in grids partly in green zones. Following the zoning plan coming into effect from Mar 2009-Feb 2014 (5 years) there were a further 10,087 fish tagged within the marine park, 82.8% were tagged in open grids, no fish tagged in grids completely in green zones and 17.2% in grids partly in green zones.
Of the 22 grids completely in green zones before the park came into effect there were 6 grids where over 100 fish were tagged and over 1,000 fish in 2 of those grids. These grids were at Scotts Point at Redcliffe and at Long Island in Pumicestone Passage. Of the remaining 16 grids less that 50 fish were tagged in each grid prior to the park coming into effect.
Of the 66 grids that were partly within green zones there was 1 grid at Peel Island where over 1,000 fish were tagged before the zoning and tagging has continued in this grid in the area still open to fishing. There were a further 11 grids where over 100 fish were tagged prior to the zoning and tagging has continued in 5 of those grids after the zoning in the areas still open to fishing. Of the remaining 54 grids there were mostly less than 20 fish tagged in each grid prior to the zoning and fish have been tagged in 18 of those grids since the zoning came into effect.
So there it is. As far as we know this is the first independent assessment of the impact of the marine park on recreational fishing even if limited to Suntag taggers. We have not provided commentary on how this should be interpreted as that is up to the readers. Each reader will make his or her own assessment of what the impact has been and that is how it should be. What Infofish Australia has done is provided some factually based independent data that provides readers with some real information on which to make their assessment. And that is how it should be.
It should also be noted that Infofish Australia has not received any funding from government to prepare the report although it does receive some limited funding for Suntag. A copy of the complete report and Google Earth maps are available from www.info-fish.net/suntag. - Bill Sawynok, Infofish Australia
Reads: 1973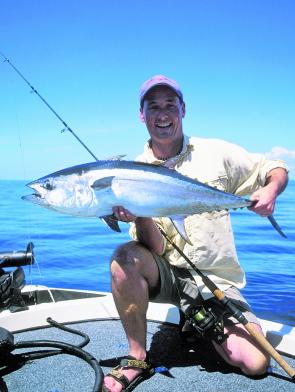
Longtail tuna are noted wanderers and pass in and out of Marine Park Zones all the time.
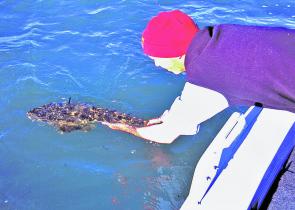
Flathead were a very popular tagging target before the Moreton Bay Marine Park zoning came in to effect and continue to be so, even after the Marine Park zoning was introduced.
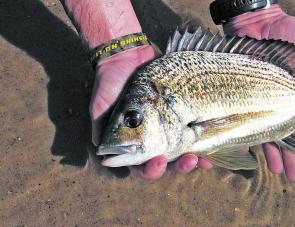
Bream, especially in the shallower and protected water zones, feature highly in the tagging lists.
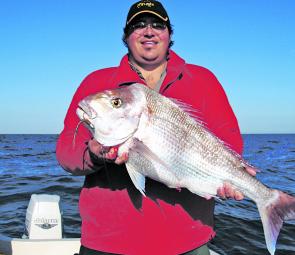
Snapper, from undersized snapper through to great fish like this, have been heavily tagged throughout the bay.
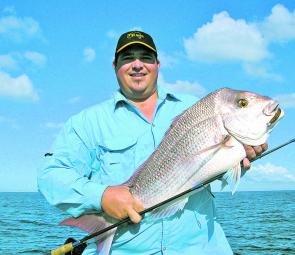
Quality snapper are not often tagged, however the species as a whole has been heavily tagged in the Moreton Bay Marine Park area.