Managing fisheries has always been a challenge, as you have to deal with conflicting groups not averse to bending the truth when it suits. And if that isn't enough, there is very limited reliable data available.
Current management theory praises of what is called "evidence based decision making". That simply means basing critical decisions on solid data and information. I bet fishery managers hate those books with a passion.
Many commercial fisheries at least maintain catch logbooks in order to produce reasonable data relating to total catch by species. But the recreational fishing sector has always stumbled when it comes to confidently knowing what it catches. We pretty much know how many people enjoy fishing based on state and national surveys and there is some extrapolated data regarding what people typically catch, but when push comes to shove, it's pretty easy to discount recreational fishing data as being "too unreliable".
So it shouldn't be that surprising that most recreational fishing sector representatives on management committees feel they are hamstrung in debates because they can't refer to good hard data to support their position.
It has always been tempting to stop banging your head against the brick wall, shrug your shoulders in frustration and put equitable fisheries management into the too hard basket. Fortunately there are people like Bill Sawynok who don't have the words "can't" and "give up" in their vocabulary. They know that data is the key and have committed themselves to knocking the bottom out of the too hard basket.
Bill now works fulltime as a self-employed fisheries consultant. Many said it couldn’t be done, but they have only served to inspire Bill to prove what can be achieved.
Back in early 1998, Bill and I dreamt up the concept of a tag and release only barra fishing competition in the Fitzroy River in Central Queensland. The original idea was to promote the quality of barra available in the Fitzroy in the hope that in time, management agencies would have to recognise its importance as a recreational fishing resource and implement some effective management arrangements to ensure its future.
That vision hasn't changed, but sadly after nine very successful Rocky Barra Bounty's, we're only marginally closer to that goal than when we started, but there is light at the end of the tunnel. We now have nine years of solid data that paints a very interesting picture of what is going on in the Fitzroy River fishery.
The structure of the Rocky Barra Bounty requires competitors accurately report a range of information relating to their fishing and captures during the event. All eligible fish must be tagged, measured and photographed prior to release, then the capture phoned through to headquarters and logged straight into the database.
The event has both lure-caught and bait-caught categories, although in most years, the majority of competitors concentrate on lure fishing. Other attractive species apart from barra frequent the Fitzroy, and most of these are eligible in the "other species" category. Like barra, these other species must be tagged and released for them to be counted towards the competition.
Every capture recorded provides details of the location of the catch against a grid map, the species, the length of the fish to the nearest millimetre, the time of day of the capture, the tag's serial number and whether it was taken on a lure or bait.
Also, when captures are phoned through, if the fish is lure-caught, the type of lure is recorded and the hooking location as well. For bait-caught fish, the type of bait used and the hooking location are recorded. The hook pattern was also recorded until the last couple of years when the event mandated that Mustad 8/0 Circle hooks be used.
From a scientific perspective, the Rocky Barra Bounty provides a perfect opportunity to gather data under very controlled conditions, repeated annually over an extended period of time. Following is a summary of that data compiled over the nine years that the Rocky Barra Bounty has been held.
The inaugural event in 1999 attracted 36 two-person teams, building up to a record 66 teams in 2007. The event has a cap of 70 teams to ensure competitor comfort and early indications are that the cap will be met well in advance of the 10th Anniversary event in October 2008.
Over the nine years of the Bounty, there have been no less than 1,828 fish tagged and released by competitors, of which 1,151 (63%) were barramundi. There have also been 159 king threadfin and 129 blue threadfin tagged and released.
The most barra caught during the event occurred in 2004, with an even 200, while the worst year was 2006, when only 64 were tagged and released. The full card of fish by species taken during Rocky Barra Bounty's is depicted in Table 1.
(Insert Fact box 1/Table 1 here)
One particularly interesting piece of data coming from the 2006 and 2007 Rocky Barra Bounty is the brand of lures that accounted for barra during these events. Over these two events, there were 179 barra caught on lures. The type and brand of lure used was recorded for all these captures and tallied.
Whilst soft plastics are making inroads into the artificial marketplace, the Bounty results clearly demonstrate that hardbodied minnow style lures are still number one when it comes to barra. No less than 93.9% of barra taken on artificial lures in the last two events were taken on hardbodied minnow designs.
It just so happens that Bounty competitors in 2007 received a special-run Rocky Barra Bounty Richo Lure in their event kit. Richo Lures are hand-made timber lures manufactured on the Capricorn Coast and have a solid reputation as one of the top 10 barra lures in the country. As event organisers, we're pleased to be able to support local products where we can.
But we couldn't have predicted the outstanding success of these lures in the Bounty. Table 2 shows that across the 2006 and 2007 Barra Bounty's, Richo Lures were responsible for the undoing of no less than 98 (54.7%) of the 179 barra taken on lures. That's a pretty amazing statistic, and what lure manufacturer wouldn't give their right arm for that sort of data? No prizes for guessing what the lure of choice will be for many competitors in the 2008 Rocky Barra Bounty.
(Insert Fact Box 2/Table 2 here)
The total fish caught during each Bounty is interesting, but can't really be validly compared from year to year. There are variables coming into play, such as the changing number of competitors from year to year. In order to compare "apples with apples", or in this case, "barra with barra", we need to drill down into the data a bit and look at "catch per unit effort" as the comparative measure.
This catch rate is generally defined as fish per person, or fish per hour. Because we have all the information relating to time actually fished per competitor, we can drill right down and provide the lowest measure of "effort" – hours per person to catch a fish.
Graph 1 shows the fish/hour and barra/hour compiled for eight of the nine Barra Bounty's conducted so far. The variability from year to year for all species has been reasonably stable, fluctuating from the worst of 15.3 hours/fish in 2001, to the best of 8.2 hours/fish in 2007. But it's been a very different picture in the case of barramundi. The best year was back in 2000, with on average across all competitors, each barra taking 10.1 hours to catch, with 2004 following close behind (the 200 fish year) with 11.3 hours per barra.
(Insert Graph 1 here)
However in 2006, conditions were awful, with water temperatures hardly getting much above 20 degrees and air temperatures not much better, hence barra put their ugg boots on and huddled around the heater. The barra catch rate was a frustrating all-time worst of 43.1 hours per barra. Fortunately some other species were willing to take bait and saved the day for many competitors that year.
So, while an impressive 200 barra were tagged in 2004, across all the 104 competitors that year, it still averaged out that it took 11.3 hours to catch a barra during the event. So is that good or bad? I'm not really sure, because we don't have anything else to compare it against. Is the Northern Territory that much better than here? I'm sure in general it probably is, but by how much? It would be nice to know wouldn't it? If only we had the data…
This is where things really get interesting. The fact that 1,151 barra have been caught across the nine Barra Bounty's is pretty impressive and surprises a lot of people who don't realise the old Fitzroy River is still home to a significant barra population.
But the Bounty data paints a pretty complex picture when it is analysed by fish size.
Only 319 (27.7%) of those 1,151 barra were 580mm long or more. Remember here that many of the competitors in the Barra Bounty are top gun fishers and are trying to catch large fish to score more points. So don't think that the smaller fish are being purposely targeted – that is definitely not the case. That statistic is more likely an indicator of the relative population size profile in the system than anything else.
Graph 2 shows the average size of all barra caught each year during the event. As you can see, 2007 was the only year where the average size of the fish caught managed to reach the minimum legal length of 580mm. We did predict that might have been the case, as recruitment has been dangerously low throughout the system since 2001 due to the drought, so what fish are left in the system are more likely to be older and larger on average. So what's going on in that system I hear you ask? Tag return data sheds some further light on that query.
(Insert Graph 2 here)
The following graph provides both interesting and disturbing data. It shows the percentage of barra tagged during Rocky Barra Bounty's that have been recaptured as time goes by. It's worth noting here that tagging has been a commonly used scientific technique for decades and a good return rate is considered to be between 4-6% for the majority of studies. In ongoing tagging research like the Suntag program, the return rate is higher, historically running at about 7-9%.
(Insert Graph 3 here)
So to be seeing a return rate running between 15-20+% should ring some serious alarm bells, especially when you factor into that figure the sad fact that only a minority of local commercial netters were returning details of tagged fish they caught. In the last couple of years, even this trickle of information from that sector has dried up, as for some reason they are now refusing to support the program. You can only imagine what the real tag recapture rate might be in the Fitzroy system!
Blind Freddy should be able to figure out that the overall fishing pressure in the Fitzroy River is extreme. Those of us who know the system intimately and have fished it all our lives marvel that it has survived this long. I'm sure that restocking efforts in the last decade have significantly contributed to the system still producing fish, but because of the refusal of most commercial netters to return tagged fish details, we are unable to accurately determine the extent of the influence of stocked fish on the entire population.
Overall tagging data from the river however, does clearly show that the overwhelming majority of legal-sized barra are caught and removed from the system by the commercial sector. That's why the catch/size data from the Barra Bounty is the way it is. The undersized barra in the system are available to the recreational sector because of the size-selectivity of netting, but once fish reach around 580mm, they are very efficiently removed from the system by nets and the proportion of this part of the barra population taken by the recreational sector is comparatively very low.
The situation in the Fitzroy graphically highlights the failings of our current management regime. It does not fairly apportion the barra population between the sectors. The commercial sector gets the lion's share of legal sized barra, despite them being the minority stakeholder when measured by economic, social and participant indicators. There urgently needs to be an effective and fairer allocation model implemented in our inshore and estuarine waters.
Can you imagine how good the recreational barra fishing in the Fitzroy River could be? I can, because I've seen how amazing it was, even as recently as the 1960's.
To read the full report of Rocky Barra Bounty Result Summaries from 1999 to 2007, visit www.info-fish.net and open the Rocky Barra Bounty page.
Data is critical. Without it, we can expect to get what we've always got – that's not an exciting prospect. – Kim Martin with data supplied by Bill Sawynok
Facts
Species and catch rates
| Year | 1999 | 2000 | 2001 | 2002 | 2003 | 2004 | 2005 | 2006 | 2007 | TOTAL |
|---|---|---|---|---|---|---|---|---|---|---|
| Barramundi | 126 | 163 | 92 | 104 | 116 | 200 | 111 | 64 | 175 | 1151 |
| Blue Threadfin | 13 | 10 | 1 | 15 | 23 | 14 | 17 | 20 | 16 | 129 |
| King Threadfin | 4 | 14 | 3 | 40 | 26 | 11 | 11 | 15 | 35 | 159 |
| Barred Javelin | 1 | 0 | 0 | 14 | 0 | 3 | 11 | 27 | 19 | 75 |
| Dusky Flathead | 1 | 0 | 2 | 2 | 8 | 8 | 8 | 8 | 16 | 53 |
| Goldspotted Rockcod | 2 | 7 | 3 | 7 | 29 | 22 | 19 | 41 | 42 | 172 |
| Blackspotted Rockcod | 1 | 0 | 0 | 3 | 1 | 0 | 5 | 8 | 1 | 19 |
| Golden Snapper (Fingermark) | 2 | 0 | 0 | 0 | 1 | 0 | 7 | 7 | 20 | 37 |
| Mangrove Jack | 0 | 1 | 0 | 0 | 0 | 1 | 1 | 3 | 1 | 7 |
| Others | 1 | 0 | 1 | 4 | 1 | 2 | 3 | 3 | 11 | 26 |
| Totals | 151 | 195 | 102 | 189 | 205 | 261 | 193 | 196 | 336 | 1828 |
Facts
Lure types catching barra
| BARRAMUNDI | 2006 | 2007 |
|---|---|---|
| RICHO MINNOW | 30 | 68 |
| OTHER MINNOW | 17 | 53 |
| SOFT PLASTIC | 1 | 2 |
| PRAWNSTAR | 1 | 7 |
| TOTAL | 49 | 130 |
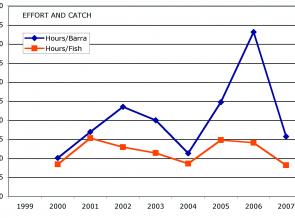
Graph 1: the fish/hour and barra/hour compiled for eight of the nine Barra Bounty's.
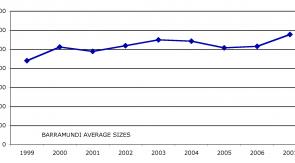
Graph 2: average size of all barra caught each year during the Barra Bounty.
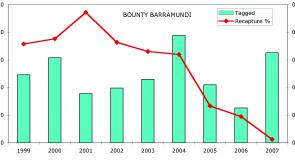
Graph 3: percentage of barra tagged during Barra Bounty's that have been recaptured.
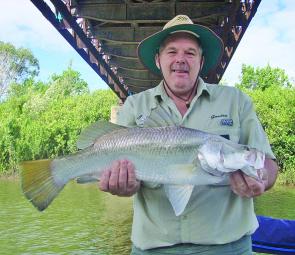
Gordon Turner is one of the few people who has competed in all of the nine Barra Bounty's held and is always pleased to catch a legal sized fish during the event